While I’m on the topic of troubleshooting, I thought that I would add some tips on how to trace packets in Microsoft Azure.
The Problem
Here are a few scenarios, in descending order from most common, that I’ve been through over the years:
Remote Desktop To New VMs
You’ve just established a new site-to-site connection between a remote location and a (probably) new Azure network. The remote site admin complains:
No packets are getting through. Your Azure network is broken.
You know that everything in Azure is in good order, and you’re pretty sure the remote site firewall is blocking the traffic. However, many systems administrators jump to “the new Azure network is broken” when something doesn’t work – even if they configured their firewall to block that damned RDP traffic (it’s nearly always RDP in the first tests!).
Connecting to PaaS Services
You’ve deployed some PaaS services in Azure. Something can’t connect to them. The client might be in the same Virtual Network. Maybe it’s in another spoke that must route through a hub? Or maybe the client is in a remote site? The developer or operator is going to say:
We’re getting timeouts when we connect. Your network is broken.
So many things could be wrong here.
SSL Goes Wrong
SSL/PKI feels to me like a dinosaur technology that:
- Most never learn
- Few who did learn it never completely mastered it (I’m here, I’d estimate)
- Those of us who did learn it have forgotten most of it
And modern application/network security is built on this deck of cards (from a knowledge perspective). I’ve seen a few scenarios:
My app gets a weird response from the database when it attempts to connect.
That one’s probably because something is reverse proxying the connection and something is going wrong in the connection – see Application Rules NATing east-west connections in Azure Firewall, causing the client IP to change.
How about this one I saw recently:
My application is failing to connect to a remote server.
When I dug into it, I saw that the TLS handshake was failing and the TCP connection was cleanly terminated. A self-signed certificate was to blame. Other scenarios I’ve seen are where Linux-based appliances fail the same handshake because the server cert doesn’t contain the full keychain. Tip: Windows LIES to you when it shows the whole keychain which it self-builds from the trusted publishers store on the machine. Most appliances require the full keychain in the cert, which many online CAs do not do by default. You’d be amazed how many weeks are wasted and repeated discusssions are had because of this.
But how have I proven this?
Complex Routing
Not everyone builds a simple hub-and-spoke. Sometimes there is a need for complexity. I had one of these a few years ago, where a customer required an ExpressRoute connection to a third-party data provider. The data provider mandated:
- An ExpressRoute connection
- The use of SNAT
The ExpressRoute Gateway doesn’t offer SNAT (unlike the VPN Gateway), so I had to conjure an interesting design. Luckily, I know Azure routing pretty well, and I tested this design in a lab. I was sure it would work – it did. But what if something went wrong? I would have had to troubleshoot what was happening.
The Need
What we need is:
- The ability to prove that packets are routing to confirm the infrastructure’s ability.
- Check how a PaaS resource has responded to connections.
- The ability to see inside those packets to investigate application-layer issues.
Folks, most of this is basic logging/querying. But there are a few tricks.
Packet Travel
I want to confirm that a packet reached A, then went to B, then got to the destination. For example:
- A packet from a remote client entered the hub and went through the firewall.
- It then routed across peering – GAH! More on this in a moment.
- And the packet routed through the destination spoke Virtual Network to reach the destination server – double GAH!
Before we proceed, I literally get session audiences to repeat the following 3 times each to enforce some basic knowledge:
Virtual Networks do not exist.
Subnets do not exist
Peering does not exist
Packets go directly from the source to the destination
This is why tracert is useless in Azure.
Understanding the above is halfway to mastering Azure networking. Please read this post before asking me questions or attempting to debate me on this topic of existence.
By the way, if you are using Azure Firewall, then (PowerShell) test-networkconnection is useful only to generate logs. The result may not be the actual result. Azure Firewall feeds “200” results from application rules, even when denying traffic. I always advise: generate the traffic and then check the logs.
Back to the topic …
The basic tool we need is a log of a packet or flow (a series of packets in a “conversation” between the client and server). Fortunately, we have a few sources of those.
The first is your firewall. Azure Firewall’s diagnostics settings send logs to your preferred destination. I prefer Log Analytics. You might prefer Splunk or similar. Potatoe Potahtoh. In Azure Firewall, the “decision making logs” include:
- Threat Intelligence (an under-appreciated and oh-so useful feature)
- IDPS
- Network rules
- Application rules
Log Analytics has a built-in query to search all those logs in a union. I can search for any combination of source IP, source port (not typically useful), protocol, destination IP, and destination port (very useful).
A third-party firewall has similar logs, often locked away in the previous grip of the firewall administrator. Sorry, I’m binge-watching Lord of the Rings, and I couldn’t help myself, firewall admins 🙂 Some firewalls can make those logs more available to other Azure operators. For example, the Palo Alto Cloud NGFW has the ability to route logs, via Application Insights, into Log Analytics, where queries, dashboards, and workbooks can share that data. Nice!
The firewall logs will show me:
- If packets entered the firewall
- If those packets were allowed or denied
The simple mention of a flow from a client to a server in the firewall log means that packets made it there:
- A spoke routed via the firewall to another spoke or a remote site.
- Packets from a remote site passed successfully over a site-to-site network connection.
The firewall log is often my first port of call. Sometimes, however, it doesn’t go deep enough. There have been a number of times where I’ve been told something along the lines of:
I can ping VM X in Azure, but I cannot make a HTTPS connection to it.
I know from experience that they have made a successful connectionless ping (ICMP). But they have failed to make a connection-oriented (TCP) HTTPS request. The stateful firewall is blocking a response to the connection request because it never saw the original SYN. Thank you to my 3rd-year networking lecturer – I can picture the guy demonstrating a luggable PC to us around 1993, but I don’t remember his name. Experience has taught me that:
- A route for the spoke network prefix is missing from the GatewaySubnet, and the request is bypassing the firewall.
- A Private Endpoint has added a /32 route to the GatewaySunet (see network policies for Private Endpoint), and routing “long prefix match” has chosen that system route over your User-Defined Route for the spoke prefix.
For these crazy situations, you need to dig a little deeper into the firewall logs. I cannot speak for third-party firewalls here. Azure Firewall doesn’t capture dropped connections such as these. For that deep dive, we need Flow Trace logs to be enabled. Note that:
- Enabling the logs does not enable the feature; this must be enabled using PowerShell.
- The logs will be very detailed – and expensive to ingest into your monitoring solution. Only leave this feature enabled while troubleshooting the issue – set a calendar entry to unset it.
I haven’t had the opportunity to use this one in the real world personally, but I wonder if I sent those JSON logs to blob storage, could I download them to Copilot and get a reasonable response to my queries? Note to self.
Did the packet traverse a Virtual Network? Now you should know that’s a dumb question. The Azure fabric takes packets from source NICs and drops them into destination NICs. The correct question is: Did a packet reach the destination NIC?
The correct solution to answer that question today is Virtual Network Flow Logs with Traffic Analytics.
The wrong answer is the deprecated NSG Flow Logs. Virtual Network Flow Logs are current and capture much better data, including Private Endpoints.
Flow Logs will tell me about:
- Outbound flows – did a packet leave a client?
- Inbound flows – did a packet reach a server?
- NSG Rules – what rule allowed/denied a connection?
Now I know if a connection:
- Left an Azure client
- Reached an Azure server
- Was allowed or denied by an NSG rule
Flow Logs take time to generate:
- The logs will take 30+ seconds to be written to blob storage. Honestly, I’ve seen this take longer during the pandemic. I think MSFT might throttle monitoring when CPU usage is in high demand.
- Traffic Analytics is configured to run every 10 or 60 minutes. I prefer the 10-minute option.
- Log Analytics will take time to process the data. I was told many years ago to allow up to 15 minutes for NSG Flow Logs to be processed.
Between the firewall logs and the Virtual Network Flow Logs, I have visibility of the traffic. Or some of it.
PaaS Resources
A PaaS resource may be deployed with:
- Public endpoint: Firewall or Virtual Network Flow Logs will show my traffic leaving my network, but not the last mile.
- Private Endpoint: Private Endpoint NICs fool us, because the packet is sent directly by the fabric from the client NIC to the NIC of the machine hosting the PaaS resource instance. Virtual Network Flow Logs show us “connectability” but not the full connection.
- VNet Injection and VNet Integration: The PaaS resources don’t really live in our Virtual Network. I know that it’s confusing.
Let me give you a working example. You have an App Service wth VNet Integration that is attempting to talk to a Key Vault with a Private Endpoint. We can see the flows in the previously discussed logs. But are the packets really getting to the Key Vault? What happens when the App Service attempts to access a secret?
The only answer to this is to enable the diagnostics settings in the Key Vault. Querying those logs in Log Analytics, Splunk, etc, will tell you exactly what’s going on:
- Was there a connection?
- Was the connection successful?
- Why did the connection fail?
Packet Capture
Don’t get scared! I promise that packet capture is easier than ever now. I’ll explain later.
The results of a packet capture show you the contents (as much as encryption allows) of packets in a flow between a client and a server. This is super useful for investigating further. Let me explain two scenarios:
In the first scenario, we have proven that packets get from A to B, but the customer/developer/operator doesn’t accept that because their application is failing. If we know the packets from client to server, then we know the error is further up the stack – it’s an application configuration or authoring issue. The only way to prove to the other person is to show them the actual packets.
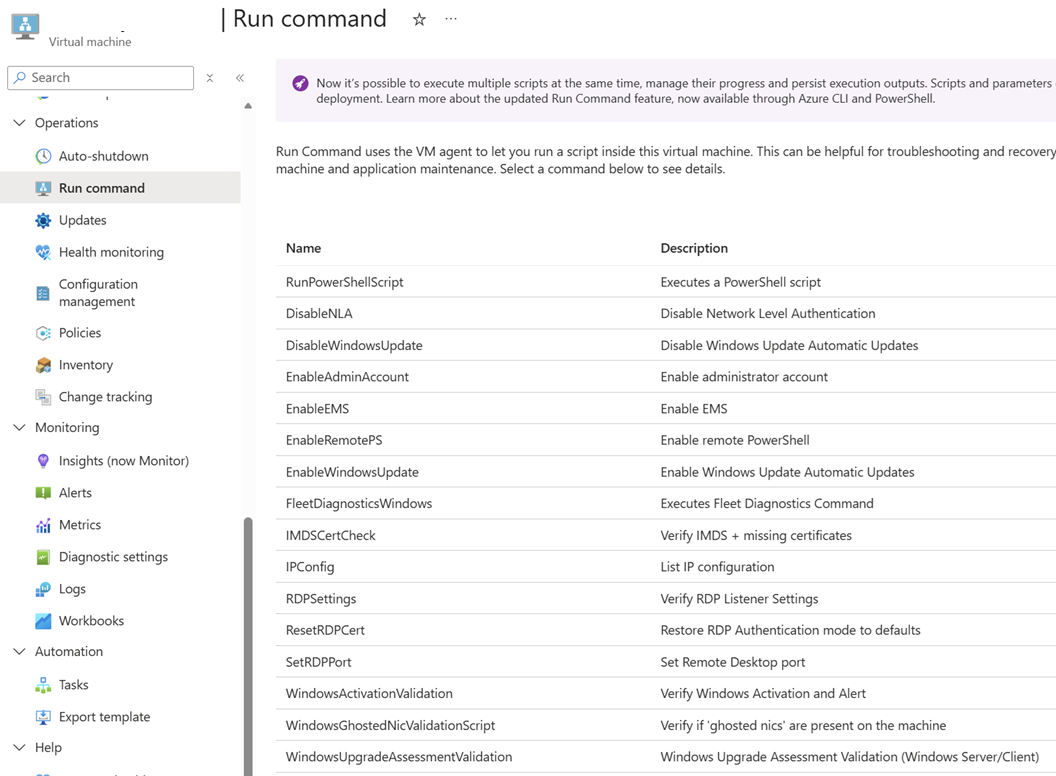
Network Watcher provides a feature called Packet Capture. The only place you need the free Wireshark client is on your PC to open the capture. Network Watcher will automatically add an Azure extension (agent) to the client/server VM, based on your Azure rights over that VM. You can capture all or filtered packets and save the resulting .CAP file to blob storage. Unfortunately, this ability is limited to VMs.
The second scenario is where we have a remote admin complaining about their failing RDP connection (it’s always this) over site-to-site networking. You’ve proven the traffic doesn’t reach the firewall/Azure VM. You know their firewall is blocking the outbound connection, but they won’t accept that. You have to prove that the traffic never crossed the site-to-site connection. You can enable packet capture on a VPN Virtual Network Gateway or a Virtual WAN VPN Gateway. This will ultimately prove that packets never got across the tunnel, and the remote admin must face the mirror.
Back to the scary part about packet captures. Who the heck can read those things? Not many of us can. I understand some basics, such as control flags like SYN, SYN-ACK, and RST. But what would I do if I had to really understand a packet capture? Enter Copilot or another AI:
- In Wireshark, click File > Export Packet Dissections > As JSON and select “Packet Range: All packets” and “Packet Format: JSON”. JSON is nice for AI to parse.
- Upload the capture to your AI and ask it your questions.
You’ll get an answer that you can work with. I used this recently for an application issue to help a (good guy) developer get to the root cause of an issue.
By the way:
- ExpressRoute does not offer packet capture, but Traffic Collector provides a Flow Log experience.
- Azure Firewall with a Management NIC (recommended by me for the last 1.5+ years) has packet capture.
Some Other Tricks
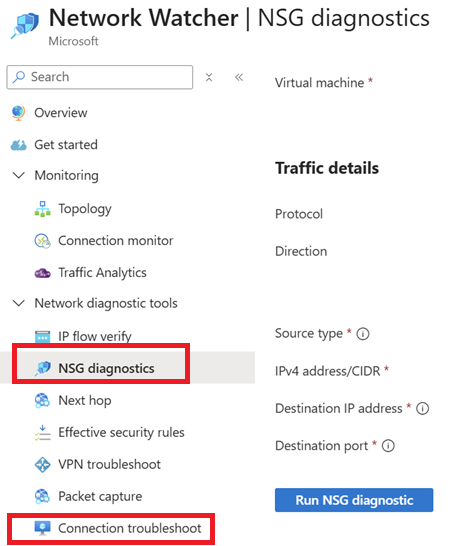
Network Watcher can be useful for doing some basic diagnostics:
- IP flow verify: Checks whether a specific traffic flow would be allowed or denied by NSG rules.
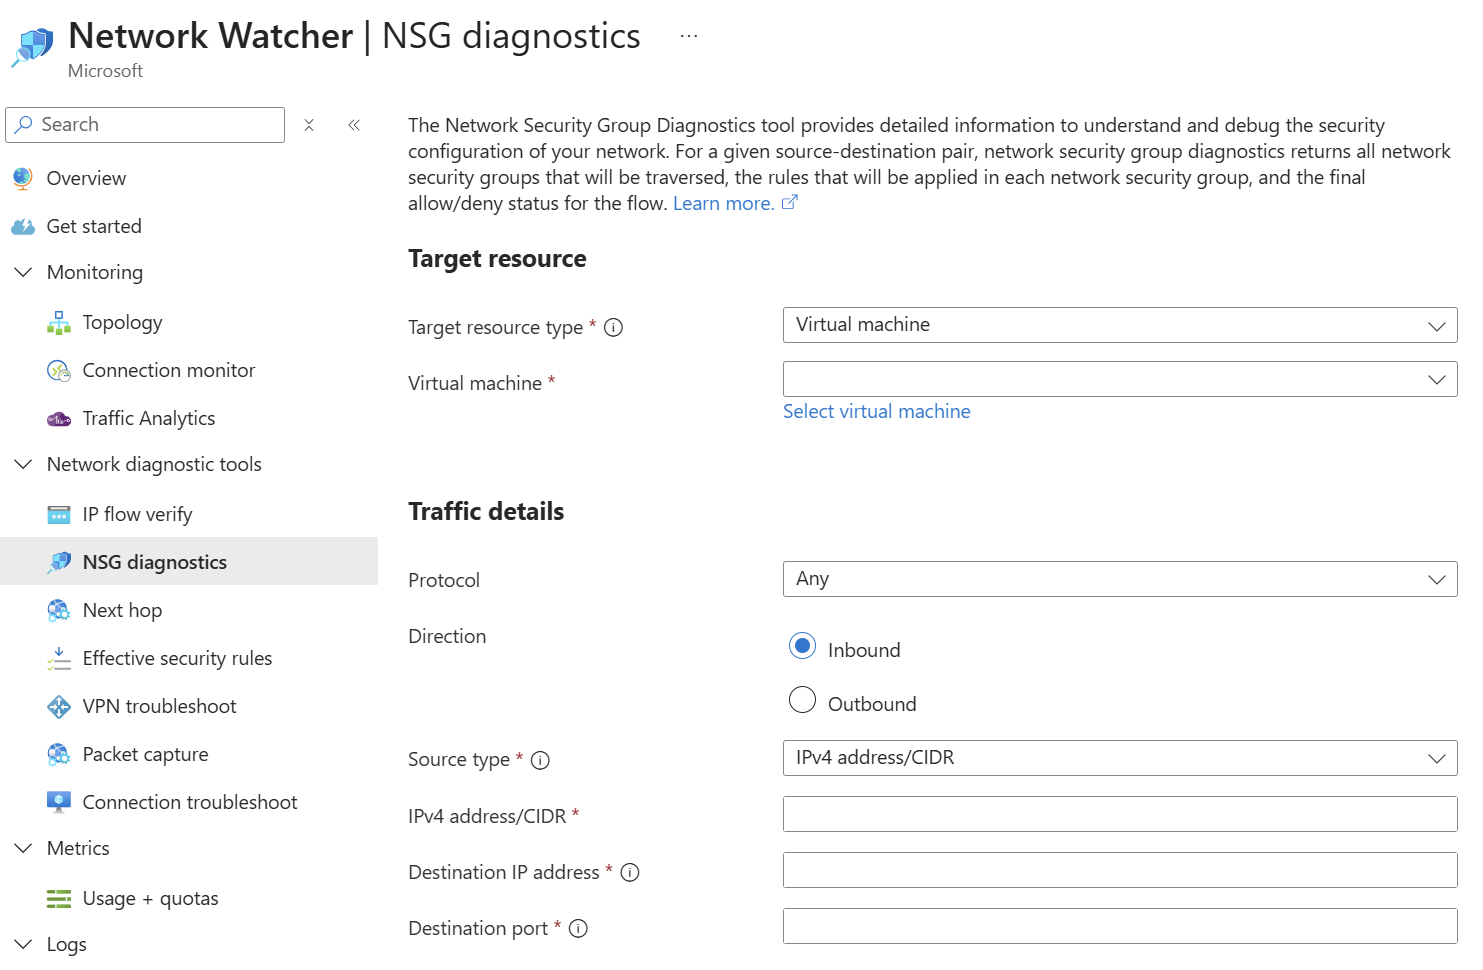
- NSG diagnostics: Analyse NSG rules across hops to identify which rule permits or blocks traffic.
- Next hop: Identifies the next routing hop a packet will take from a selected VM.
- Effective security rules: Displays the combined, active security rules applied to a network interface after all NSGs are merged.
- VPN troubleshoot: Diagnoses issues with Azure VPN gateways and site‑to‑site or point‑to‑site tunnels.
- Packet capture: Captures packet data directly from a VM’s network stack for deep traffic analysis.
- Connection troubleshoot: Tests end‑to‑end connectivity between a VM and a target to identify routing or NSG issues.
Connection Troubleshoot is especially nice:
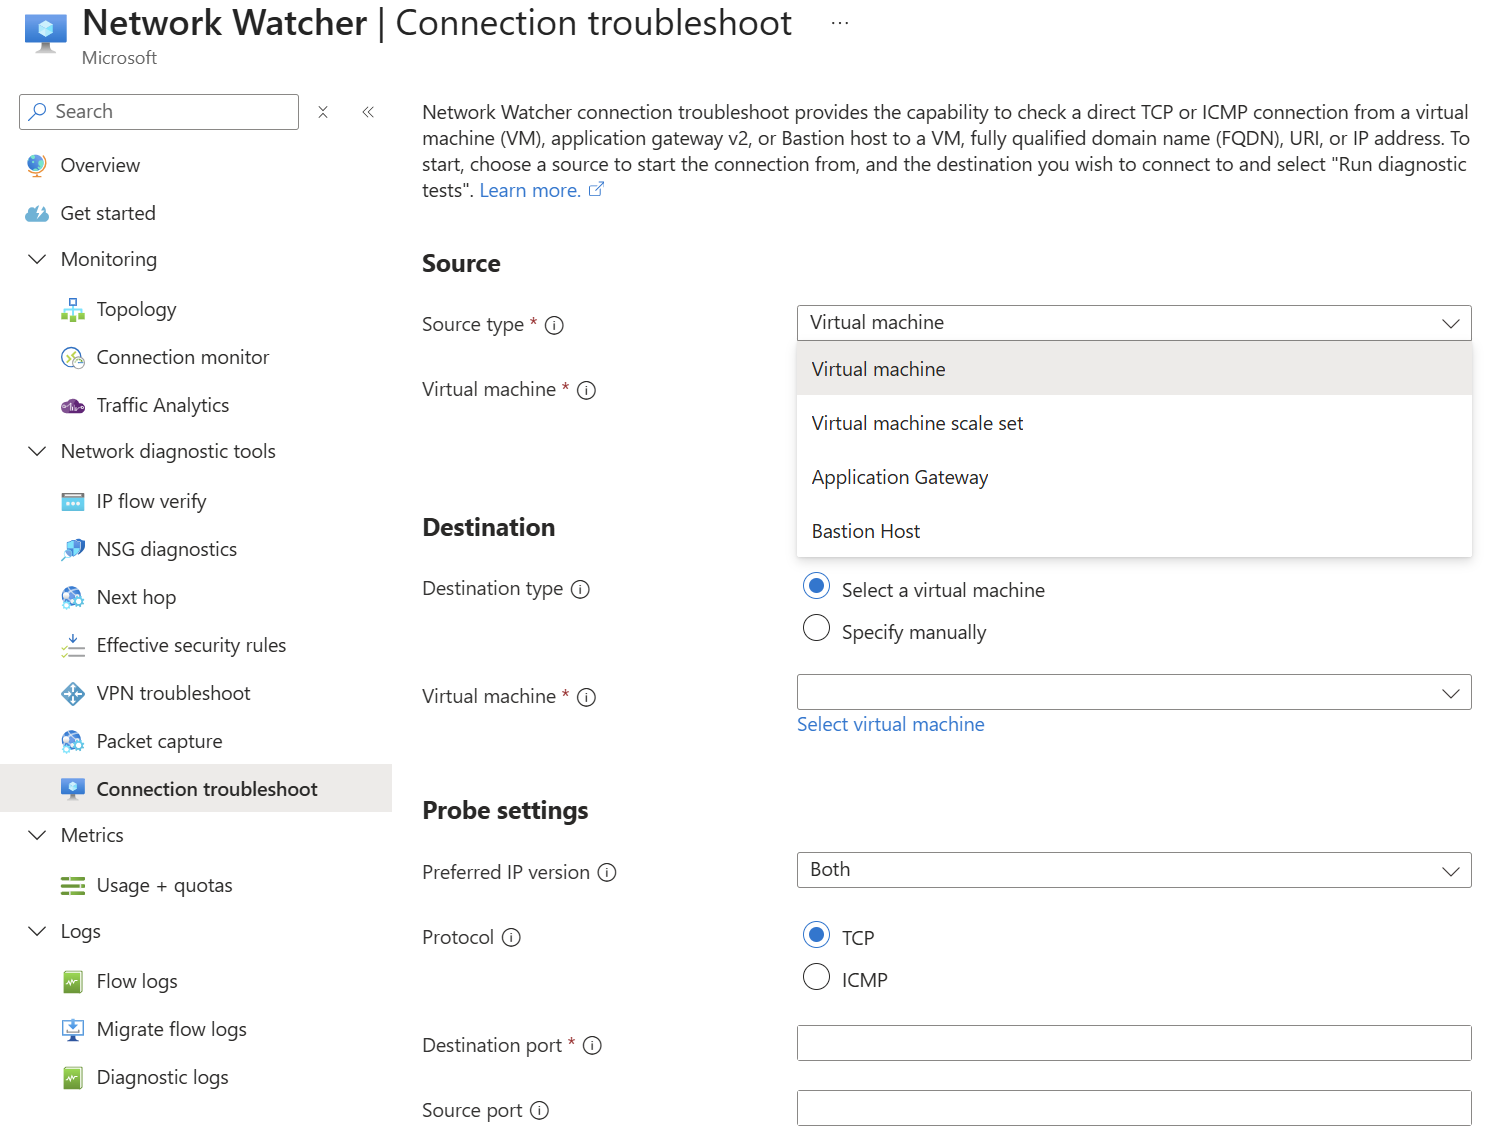
We can send a bunch of probe packets from a source to a destination and see if the connection was successful. If not, the tool gives you some indication why – keep in mind that remote destinations will result in vague failure reasoning because Azure doesn’t control remote locations.
The sources can be:
- VMs and VM Scale Sets: Using the Network Watcher extension.
- Application Gateway: Great for figuring out those pesky backend health issues and proving that the CA-provided cert (lacking the complete trust chain) is the cause of the failure.
- Bastion Host: Bastion-to-VM connections can be a head-wrecker.
If there is a connection that is working but you consider to be critical, then I recommend using Connection Monitor in Network Watcher:
- Works with any mix of Arc agents (non-Azure VMs) and Azure VMs – consider those remote site connections!
- Model application connections.
- Tests success and speed (latency).
- Can trigger an alert/Action Group.
I used this a few years ago for a SaaS company that was using Placement Proximity Groups as a part of their need to minimise latency. I wanted proof of the platform performance, just in case. My colleague who wrote the Terraform for modelling the application in Connection Monitor probably didn’t like me for requiring this 😉 I started seeing alerts one day, so I let the customer know that I was opening a support ticket with Microsoft. We found out that there was a physical issue with one network appliance, and Microsoft fixed it. Wow – not only were we monitoring our infrastructure and the application’s networking, but we were monitoring Azure’s physical network too!
Last Tool
The last tool is you, not Copilot. Honestly, Azure Copilot is not good at this stuff. I’ve tested it in my build labs, and it hasn’t a clue (thankfully for us IT pros). You need a combination of:
- Experience: What’s most common?
- Intuition: Listen to the customer – did they just mention a cert, for example?
- Knowledge: Understanding how Azure networks function is critical – did you know that not setting the network policies for Private Endpoint in your subnet causes asynchronous routing in the firewall?
Using your tools will better prepare you to use the above Azure tools.
If You Liked This …
Maybe you liked this post and are wondering: “Could Aidan help me?” Maybe I can through my company, Cloud Mechanix. Whether you need a review, design something, figure out some issue, do a large deployment, or figure out why the cloud is not working for your organisation, I can help – and other things too. Cloud Mechanix works with large and small organisations and service providers throughout Europe. Check out the site, and contact me if you are interested.